Overview
SA Housing Authority continues to maintain a strong financial foundation through the ownership and management of more than 34,000 properties with a value of $10.6 billion.
Asset portfolio value $B
Trend Line Chart Description: Asset portfolio value for each financial year from 30th June 2008 to 30th June 2019
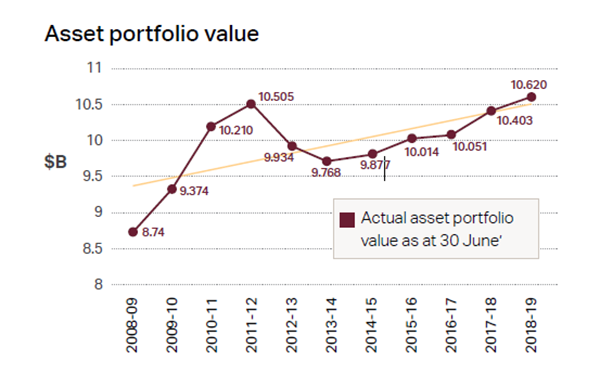
- Year 2008 to 2009 - $8.74B
- Year 2009 to 2010 - $9.374B
- Year 2010 to 2011 - $10.210B
- Year 2011 to 2012 - $10.505B
- Year 2012 to 2013 - $9.934B
- Year 2013 to 2014 - $9.768B
- Year 2014 to 2015 - $9.877B
- Year 2015 to 2016 - $10.014B
- Year 2016 to 2017 - $10.051B
- Year 2017 to 2018 - $10.403B
- Year 2018 to 2019 - $10.620B
Operating revenue $M
Bar Chart Description: Operating revenue, Rents & recoveries, Interest, Government grants, Net gain on asset sales, other revenue for each financial year from 30th June 2019 to 30th June 2024
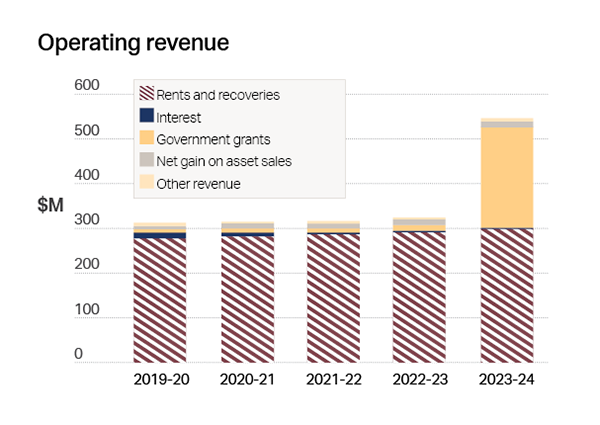
- Year 2019 to 2020 - Value $307.795M (encompassing - Rent and recoveries, Interest, Government Grants, net gain on asset sales, and other revenue)
- Year 2020 to 2021 - Value $313.127M (encompassing - Rent and recoveries, Interest, Government Grants, net gain on asset sales, and other revenue)
- Year 2021 to 2022 - Value $314.564M (encompassing - Rent and recoveries, Interest, Government Grants, net gain on asset sales, and other revenue)
- Year 2022 to 2023 - Value $323.338M (encompassing - Rent and recoveries, Interest, Government Grants, net gain on asset sales, and other revenue)
- Year 2023 to 2024 - Value $547.642M (encompassing - Rent and recoveries, Interest, Government Grants, net gain on asset sales, and other revenue)
The main sources of the Authority’s operating revenue are rents and Government Grants. Rent revenue is budgeted to increase marginally to 2025, mainly through indexation of rental charges (dependent on Commonwealth policy). Rent revenue
is limited by the Authority’s policy of charging rent at no more than 25% of eligible income for most tenants. This results in just under half of the market- assessed rent on the Authority’s property portfolio being foregone through the provision of this subsidy (approximately $200 million per annum).
As a result of revised funding arrangements in 2018-19 the Authority received a one-off grant payment of $602 million, being an up-front payment of grants previously budgeted to be received over the four-year period 2019-20 to 2022-23. From 2023-24 these grants will resume, but are subject to government policy and decision-making.
Rent Revenue
- 46% Rent foregone
- 54% Rent charged to tenants
2019-2020 Cost Structure
Pie Chart Description: Overview clockwise from top right around to the top left
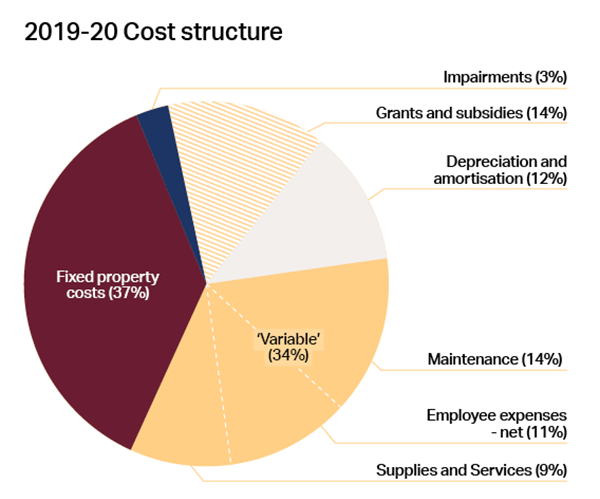
- 14% Grants and subsidies
- 12% Depreciation and amortisation
- 14% Maintenance (variable)
- 11% Employee expenses - net (variable)
- 9% Supplies and Services (variable)
- 37% Fixed property costs
The total operating expenditure of the Authority in 2019-20 is $745 million.
Of this expenditure only 34% is considered variable.
Only a limited portion of the maintenance expenditure can be considered variable because a high proportion is responsive (restoration of faults or breakages to working condition), and a further component relating to health and safety
requirements. The ageing asset base and increasing complexity of customer needs are placing upwards pressure on maintenance budgets.
Challenges
Despite funding certainty coming from the National Housing and Homelessness Agreement, which recognises the Commonwealth and the State’s mutual interest in improving housing outcomes across the housing spectrum, the Authority has very few levers to generate revenue or reduce existing expenditure commitments.
To 2025, the Authority has a number of mandated operating efficiency targets. The achievement of savings through reductions in expenditure presents challenges for the management of the Authority’s assets and the delivery of services to customers.
| Year | 2018-19 | 2019-20 | 2020-2021 | 2021-22 | 2022-23 | 2023-24 |
|---|---|---|---|---|---|---|
| Operating efficiencies $m (cumulative) | 19.463 | 30.983 | 35,540 | 42.177 | 44.906 | 45.954 |
| Annual savings target $m | nil | 11.52 | 4.557 | 6.637 | 2.729 | 1.048 |
| FTE's (cumulative) | 72.5 | 106.0 | 140.0 | 187.0 | 191.0 | 191.0 |
| Annual FTE saving | nil | 33.5 | 34.0 | 47.0 | 4.0 | 0.0 |
Strategic asset management and renewal programs $M
Bar Chart Description: Capital expenditure and Revenue from asset sales for each financial year from 30th June 2019 to 30th June 2024
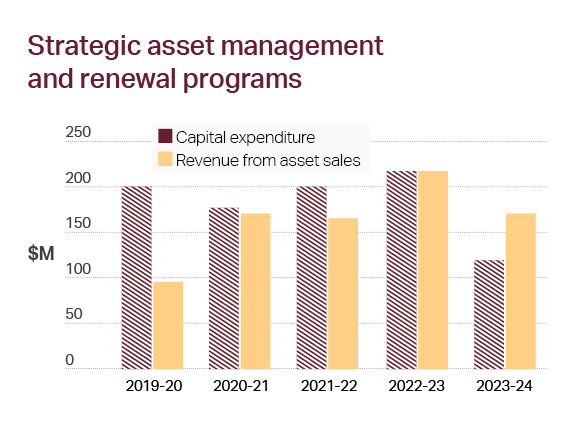
- Year 2019 to 2020 - Value Capital expenditure $199.016M and Revenue from asset sales $ 94.949M
- Year 2020 to 2021 - Value Capital expenditure $172.176M and Revenue from asset sales $168.756M
- Year 2021 to 2022 - Value Capital expenditure $199.91M and Revenue from asset sales $ 165.296M
- Year 2022 to 2023 - Value Capital expenditure $213.326M and Revenue from asset sales $213.273M
- Year 2023 to 2024 - Value Capital expenditure $123.748M and Revenue from asset sales $162.347M
Our Housing Future 2020-2030 includes a strong focus on the system to facilitate affordable housing outcomes but also the development of a strategic asset management plan that sets targets for social housing. This plan seeks to set targets to maintain an appropriate supply for future demand within constraints, market conditions, and investment opportunities that arise.
The Authority’s current asset base is large, but a mismatch of stock to customer needs continues to result in vacancy and underutilisation of dwellings. Contributing factors include ageing properties, houses in low-demand locations, and assets with configurations that are not meeting current demand, and are not projected to meet the future demand
of customer profiles. The Authority’s future asset planning must better meet the needs of customers through strategic divestment and delivery of suitable built form.
Whilst property sales within a strategic asset renewal program will continue, the component of sales that fund recurrent operations will be reduced by 76% in the next three years from peak sales in 2013-14. Moving forward, a sophisticated strategic asset management approach that identifies and addresses these complexities will be developed.
Financial viability sales
Bar Chart Description: Financial viability sales for each financial year from 30th June 2011 to 30th June 2023
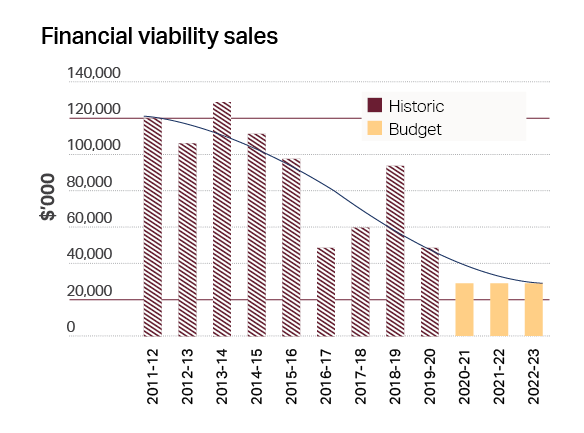
- Year 2011 to 2012 - Value $120,840 (Historic)
- Year 2012 to 2013 - Value $104,324 (Historic)
- Year 2013 to 2014 - Value $126,718 (Historic)
- Year 2014 to 2015 - Value $113,435 (Historic)
- Year 2015 to 2016 - Value $97,923 (Historic)
- Year 2016 to 2017 - Value $50,845 (Historic)
- Year 2017 to 2018 - Value $58,718 (Historic)
- Year 2018 to 2019 - Value $94,104 (Historic)
- Year 2019 to 2020 - Value $49,377 (Historic)
- Year 2020 to 2021 - Value $30,843 (Budget)
- Year 2021 to 2022 - Value $30,843 (Budget)
- Year 2022 to 2023 - Value $30,843 (Budget)
The Authority has significant capital commitments to 2025, and will need to invest in the resources and infrastructure to deliver 1,000 affordable housing outcomes. While total capital expenditure to 2025 is $908 million, the total asset investment over
this period is $1.462 billion (inclusive of recurrent maintenance).
This program provides an exciting opportunity, and heralds a bright future where South Australia will once again reinvest in and reinvigorate the affordable housing market.

